Why I Stopped Counting Views and Started Counting Buyers
46 TikTok views, $0. 340 users, 37 buyers, $339.56. The metric you optimize for changes what you build.
46 TikTok views, $0. 171 ad impressions, $5. The first felt like growth. The second felt like maintenance. The first was the noise.
That was Day 7 of a 30-day revenue challenge, and the moment I swapped vanity metrics for buyer metrics. This post is the dashboard that replaced the old one, and what optimizing for buyer activation actually changes about what I build.
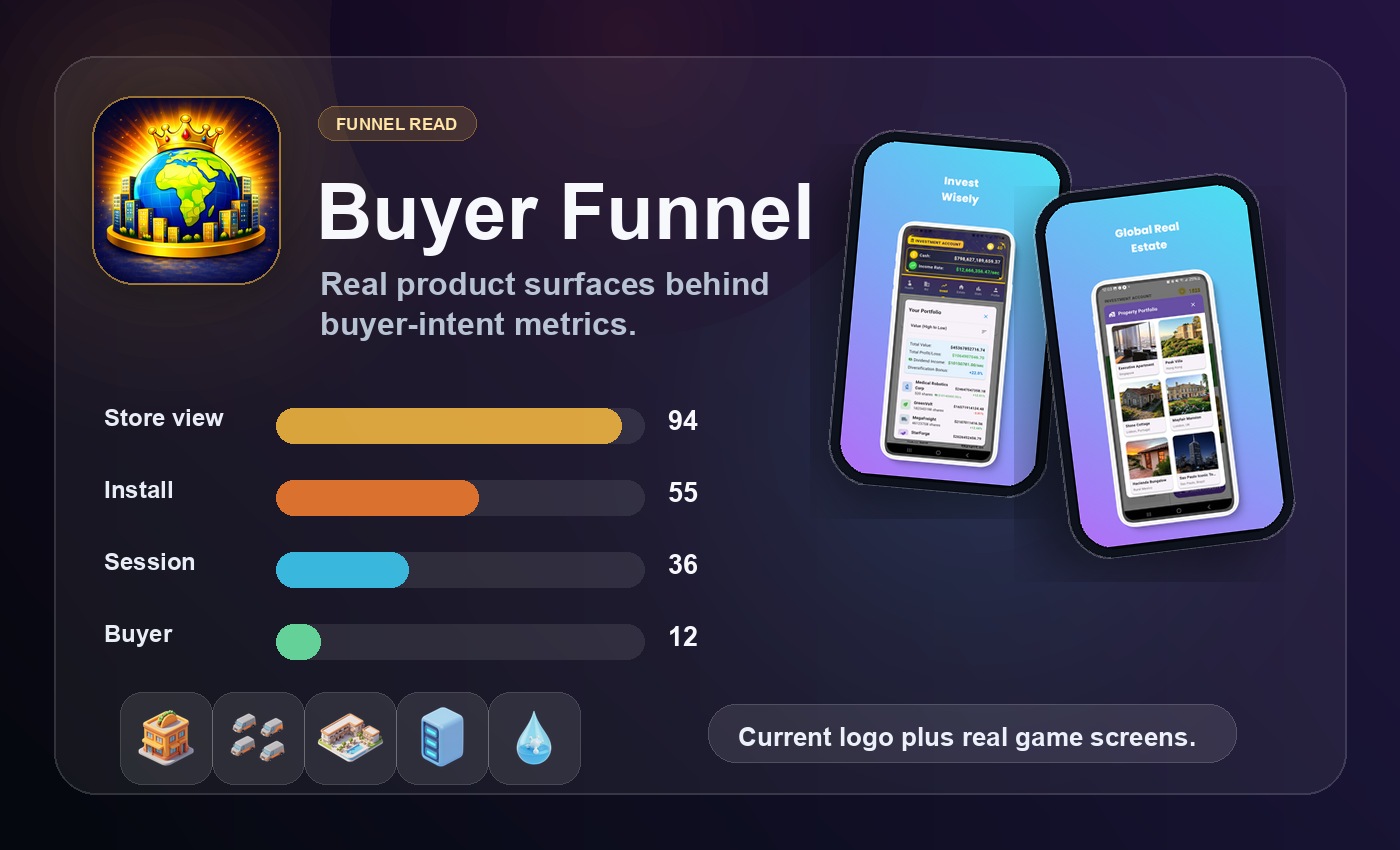
Existing Empire Tycoon gameplay screenshots: the product surface behind the buyer metrics in this post.
Views changed what I posted. Buyers changed what I built.
Once the dashboard centered paid behavior, the work moved away from social-platform dopamine and toward session depth, IAP prompt placement, retention, and the prestige loop.
The dashboard swap
Views were unowned
Off-platform impressions did not carry revenue without attribution.
Sessions were owned
In-game activity created ads, IAP exposure, and return behavior I could improve.
Buyers changed priorities
Prompt placement and retention beat posting frequency once money was the metric.
The funnel was measurable
Each step from user to buyer had an observable lever.
The view-count trap
NOTE
Views feel like progress. They feel like an audience. They feel like the thing you'd brag about. Then you do the conversion math and remember that views are a leading indicator of nothing on a platform you don't own.
The clip got 46 views on TikTok — a platform I had no audience on, posting under a brand handle I'd created the week before. No ad share at that audience size, no link-in-bio engagement above noise, no measurable lift on the install rate. Forty-six dopamine hits and zero dollars.
Meanwhile that same Tuesday, the in-game ad funnel served 171 impressions to real players inside a session. 171 events monetizing directly through AdMob, plus an unknown number of those same players who'd later return to spend on IAPs.
The math that broke me
| Metric | What I thought it meant | What it actually returned |
|---|---|---|
| 46 TikTok views in 24h | "Audience is forming" | $0, no install lift |
| 171 ad impressions on peak day | "Just maintenance" | $5+ AdMob earnings, real |
| 340 lifetime app users | "Market validation pending" | 37 buyers, $339.56 |
The view-to-revenue ratio isn't a constant. It depends on platform economics, audience ownership, and whether the impression is on-platform-for-me or off-platform-for-me. An impression inside the game is mine. A view on a platform I don't own is not.
The week I made the swap, I stopped optimizing for clip views and started optimizing for in-game session count. The revenue effect was visible within two weeks.
The pivot to buyer counting
Each transition is measurable. Each transition has a cost-effective lever I can pull. None of those levers look like "post more clips on a platform I don't own."
The replacement metrics:
- DAU — survives bot traffic, survives off-platform noise.
- D1 / D7 retention — early signal of whether the game is worth coming back to.
- IAP funnel rate — install → first session → engaged session → buyer.
- Buyer activation events — what the player did in the 60 minutes before they spent.
- Time-to-first-conversion — how long from install to first IAP.
The honest dashboard
| Stat | Value | What it says |
|---|---|---|
| Total users | 340 | Modest cohort |
| Bounce rate | 73% | Three-quarters never return after first session |
| Engaged buyer pool | 58 | Cohort that ever entered the IAP funnel |
| Paid buyers | 37 | Cohort that converted |
| Power users | 10 | Cohort that prestiged + drives ad revenue |
| Fastest prestige | 36 min | First-session intent is real |
73% bounce was the most uncomfortable number on the dashboard, and the most useful. It told me three-quarters of installs weren't the audience. The remaining 27% — about 90 users — was where every meaningful metric came from. Optimizing the funnel for those 90 produced 37 buyers and $339.56 over 90 days. Optimizing for clip views would have produced 46 views and zero dollars.
What I optimize for now
| Vanity metric | Buyer metric | Why |
|---|---|---|
| Clip views | Sessions per DAU | Sessions correlate with revenue; views don't |
| Followers | Active buyers in last 30 days | Buyers churn into and out of cohorts; followers don't |
| Impressions on social | Ad impressions in-game | One pays; the other doesn't |
| Reach | D7 retention | Reach is a wish; retention is observable |
| Engagement rate (likes/comments) | IAP funnel completion rate | Likes don't pay rent |
The right column changes what I build. When the metric is buyer activation, I spend my time on IAP prompt placement, rewarded-ad placement, the daily-login reward, and the prestige loop — every one of which moves a buyer metric. When the metric was clip views, I spent time on hooks, captions, and posting frequency. None of those moved a buyer metric. Not one.
When views still matter
There is one case where views are the right metric: when I'm using social as a top-of-funnel pipe with an in-game-attribution link, and the install rate from those views is measurable. In that case, views are a proxy for installs, and installs are a proxy for the buyer-funnel input.
The test is whether I can answer "how many of the people who watched that clip installed the game?" If yes, views are buyer-adjacent and worth tracking. If no, views are vanity. Forty-six TikTok views with no attribution link was vanity. The same forty-six views with a measurable install attribution would have been a different conversation — probably still bad numbers, but at least readable.
The shift didn't make me stop posting clips. It made me stop counting clips. Buyer metrics live on the dashboard now. Clip metrics live in a separate file I check once a month, mostly to confirm that nothing surprising has changed.
See what 37 strangers paid for
Empire Tycoon is the funnel I optimize against. Free to play, monetized with rewarded ads and IAPs. Every buyer number in this post came from this game.
Get Empire Tycoon